
Home
Gallery/Latest
AllSky Camera
Equipment
Observatory
Location/Light Pollution
Radiation Monitor
Observatory Weather
WSO Background Radiation Monitor
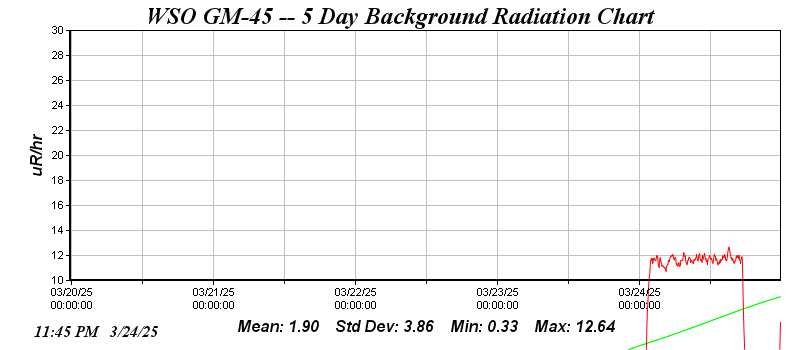 - Radiation Monitor #1: Black Cat Systems GM-45 -
The GM-45 monitor uses a pancake GM probe, sensitive to alpha, beta and gamma radiation.
The Average Natural Background Radiation for Fort Worth, Texas area is 68.7 mR per year / 7.8 uR per hour.
Chart updates automatically every 5 minutes.
What Does This Mean?
Do not panic because you see a high reading! It could be the equipment is getting invalid readings.
Note that readings do fluctuate over time, this is normal for geiger counters!
Treat this for information purposes only.
Do not make safety decisions based upon this information.
Typical background radiation levels for most of the USA are in the 5 to 28 uR/hr range. Readings can be higher for brief periods of time due to normal variations in radiation levels. Rain, the time of day, and changing weather often cause readings to vary, sometimes by fairly large amounts (see more on this below)! They can also be consistently higher for areas at high elevations such as Colorado, or with larger natural deposits of uranium, thorium, radon, etc.
Why Does Gamma Radiation Increase When It Rains?
Sharp temporary increases in gamma radiation are often seen during moderate to heavy rains. Water drops sweep radioactive particles from higher levels in the atmosphere to ground level. Although these sudden increases may appear to be somewhat alarming, the actual radiation level still remains quite low. You receive higher levels of radiation during a typical flight on an airliner!
Sharp temporary increases in gamma radiation are often seen during moderate to heavy rains. Water drops sweep radioactive particles from higher levels in the atmosphere to ground level. Although these sudden increases may appear to be somewhat alarming, the actual radiation level still remains quite low. You receive higher levels of radiation during a typical flight on an airliner!
Why are readings often highest in late morning hours,
and lowest during early afternoon?
Studies show it is normal for the background gamma radiation levels to be highest in late morning hours, peaking in the early morning hours and lower in the early afternoon hours. This is often quite apparent on the observatory's sensitive RM-19 background radiation monitor!
The daily diurnal pattern of natural gamma radiation is mainly due to the influence of meteorological conditions which cause variations in ground level concentrations of Radon daughters, caused by the radioactive decay of Radon.
- Additional Resources -
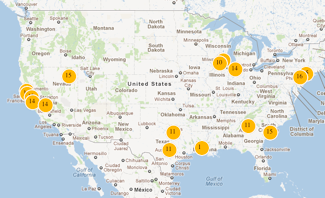
A Live Online Background Radiation Map for North America,
including data from Watauga Skies Observatory's GM-45 Radiation Monitor can be viewed here:
Concerned about Radon levels where you are located? Learn more here:
EPA - Radon Information
This data is provided for Informational Use Only. During severe weather events at the observatory, monitor data may not be available.
Do not make personal safety decisions based upon this information.
 |
All content ©2004-2023 - Permission granted for individual & educational use provided credit is given to Watauga Skies Observatory |